What should I check first on the dashboard?
Treat the dashboard as a triage surface. It tells you whether the problem is fleet-wide, device-specific, capacity-related, or tied to recent operator activity.
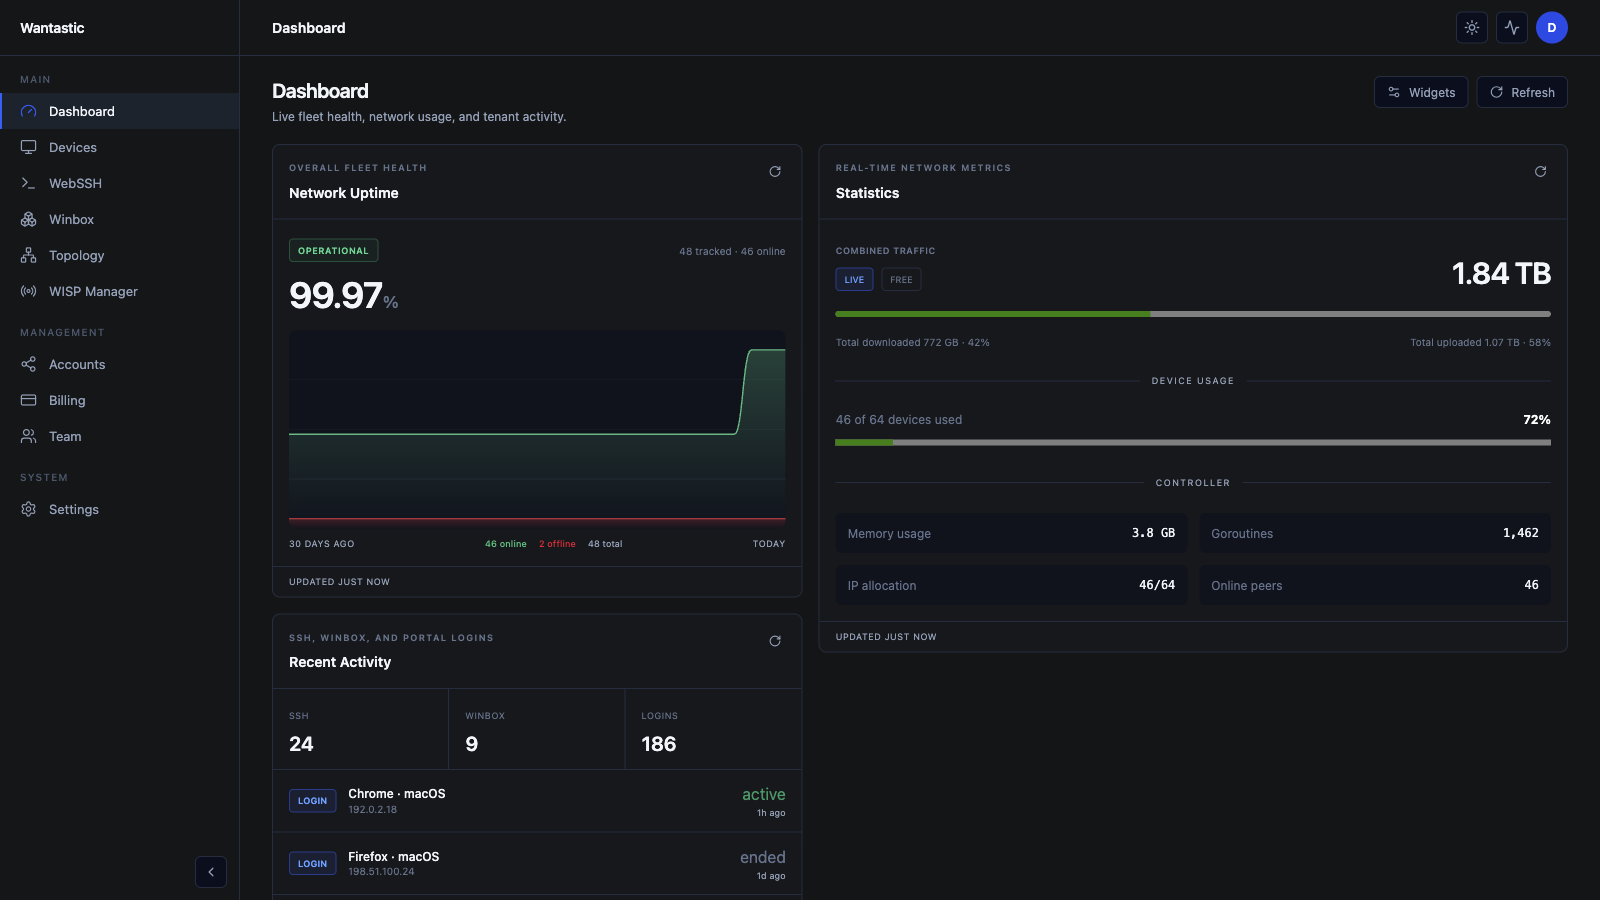 Live beta UI with sanitized demo data
1. Start with Network Uptime
The uptime card shows the tracked fleet, online and offline counts, and recent history. A sudden drop across several devices usually points to a shared provider, hub, DNS, or control-plane problem. One offline endpoint is more likely a site, power, or device issue.
Select Refresh before escalating so you are not working from a stale snapshot.
2. Read traffic and capacity together
The Statistics card combines uploaded and downloaded traffic, device allocation, controller memory, goroutines, IP allocation, and online peers.
Use these signals together:
- traffic rose but peers stayed stable: inspect the busiest devices;
- peer count fell: open Devices and filter offline endpoints;
- IP allocation is near the plan limit: plan capacity before onboarding;
- controller resources changed sharply: compare with recent activity and service health.
The dashboard is a lead, not a substitute for device-level evidence.
3. Use Recent Activity for context
Recent Activity separates SSH, Winbox, and portal logins. It helps answer whether a change followed a technician session or an account login.
For an incident:
- note the time the device changed state;
- compare it with recent Winbox and WebSSH sessions;
- open Accounts → Sessions when account-level detail is needed;
- revoke unexpected sessions before making network changes.
4. Move to the correct detail screen
Use the left navigation based on the question:
| Question | Open |
|---|---|
| Which endpoint is offline? | Devices |
| Can I reach the shell? | WebSSH |
| Can I manage RouterOS? | Winbox |
| Which peers and links exist? | Topology |
| Which managed CPE needs attention? | WISP Manager |
5. Build a repeatable daily check
A useful NOC routine is:
- refresh dashboard data;
- confirm tracked, online, and offline counts;
- scan traffic direction and device allocation;
- review recent privileged sessions;
- open the affected device or topology;
- record the result in the operational ticket.
That turns the dashboard into a consistent starting point instead of another screen of disconnected metrics.